Q1. We have deployed a few PODs running workloads. Inspect them. Wait for the pods to be ready before proceeding to the next question.
A1. OK
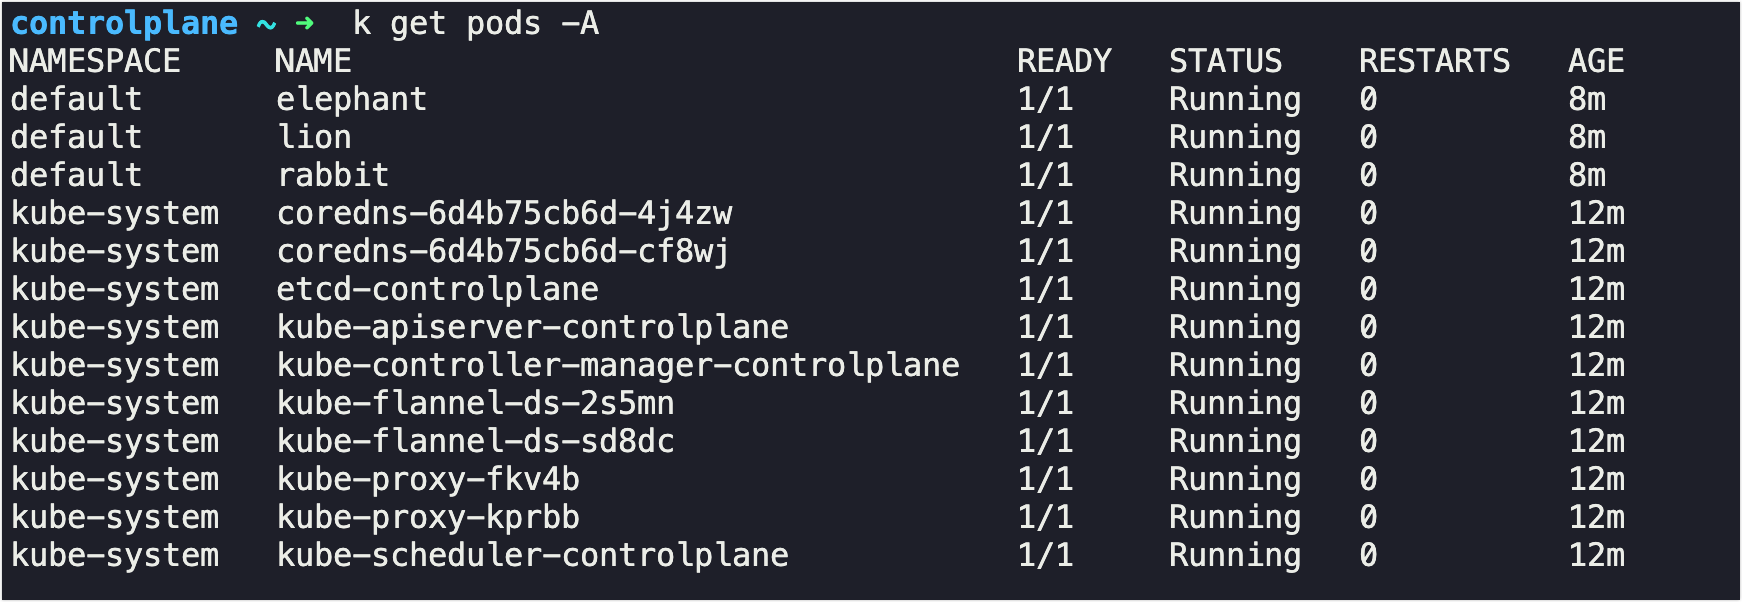
Q2. Let us deploy metrics-server to monitor the PODs and Nodes. Pull the git repository for the deployment files.
- Run: git clone https://github.com/kodekloudhub/kubernetes-metrics-server.git
A2. OK
Q3. Deploy the metrics-server by creating all the components downloaded. Run the kubectl create -f . command from within the downloaded repository.
A3. kubelctl create -f .
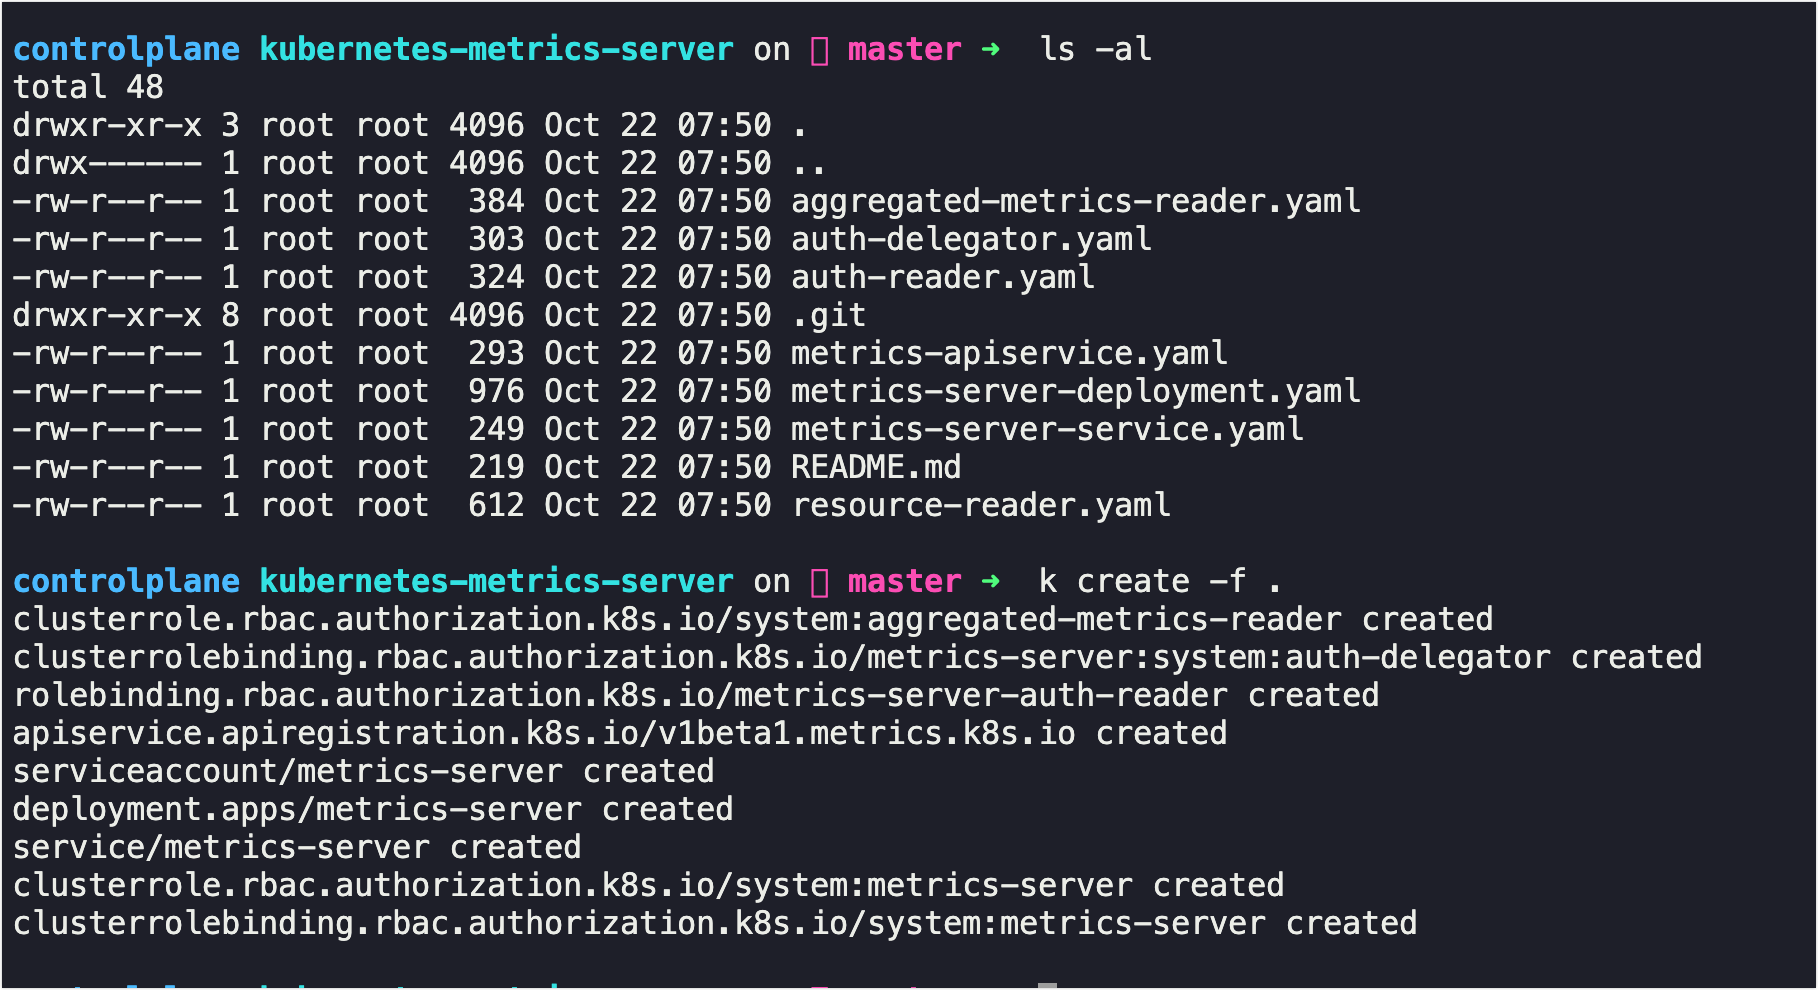
Q4. It takes a few minutes for the metrics server to start gathering data. Run the kubectl top node command and wait for a valid output.
A4. OK
Q5. Identify the node that consumes the most CPU.
A5. controlplane

Q6. Identify the node that consumes the most Memory.
A6. controlplane
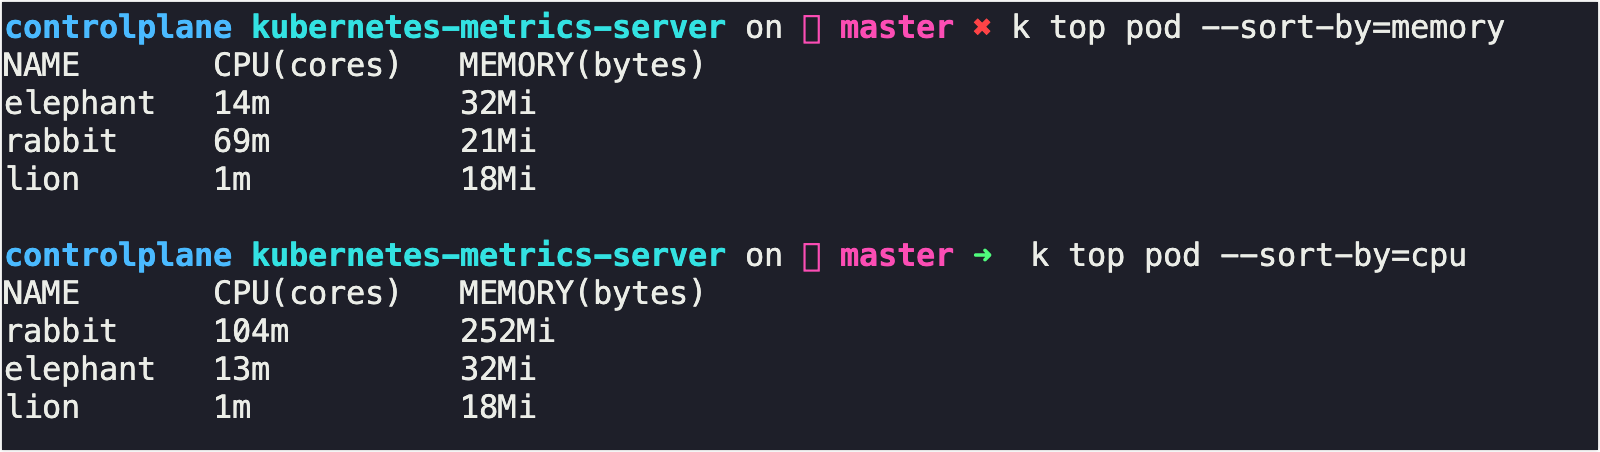
Q7. Identify the POD that consumes the most Memory.
A7. rabbit
Q8. Identify the POD that consumes the least CPU.
A8. lion
모니터링 연습문제라 어려운것은 없었다. 대부분 kubectl top node 또는 pod를 보는 방법에 대한 문제였다.
kubectl top node 또는 pod를 하면 이것은 기본적으로 NAME을 기준으로 내림차순으로 보여준다.
하지만 내가 보고싶은것은 NAME 기준이 아니라 CPU 또는 Memory 기준이므로 이럴 때는 --sort-by 옵션을 준다.
--sort-by=cpu 또는 memory를 할 경우, 각 지표에 대해 내림차순으로 보여주기 때문에 과점유 또는 저점유하는 자원을 확인할 수 있다.
'자격증 쌓기 > [k8s] CKA Study' 카테고리의 다른 글
| [k8s] KodeKloud Practice test -Commands and arguments (0) | 2022.10.24 |
|---|---|
| [k8s] KodeKloud Practice test -Rolling Updates (0) | 2022.10.22 |
| [k8s] KodeKloud Practice test -Multiple Schedulers (0) | 2022.10.21 |
| [k8s] KodeKloud Practice test - Daemonset (0) | 2022.10.20 |
| [k8s] KodeKloud Practice test - Node Affinity (0) | 2022.10.10 |